AI benchmarking has a reproducibility problem because flexible choices around prompts, datasets, metrics and reporting can materially change a model’s apparent performance. My analysis of 3,793 open LLMs found real scaling gains and capability ceilings, alongside model-dependent estimates of selective-reporting inflation.
What is the AI reproducibility crisis?
An LLM benchmark score can look like a hard fact: one model, one test, one number. But that number sits at the end of a long chain of choices—prompt wording, few-shot examples, decoding settings, datasets, metrics, exclusions and reporting decisions. Change enough of those choices and the apparent winner can change too.
That does not mean every benchmark is fraudulent or useless. It means the score is only as trustworthy as the evaluation trail behind it. Reproducibility asks whether another team can follow that trail, repeat the evaluation and reach a meaningfully similar result. Too often, the trail is incomplete.
For a business deployment, AI agent development should be tested against the tasks and failures that matter in your workflow, not a leaderboard position alone.
Why benchmark scores can look cleaner than the process behind them
Machine-learning evaluation creates a large researcher-degrees-of-freedom problem. Teams can make many individually defensible choices, inspect the outcomes, and then report the combination that tells the strongest story. The final table looks clean. The search path that produced it disappears.
- Prompt cherry-picking: trying multiple phrasings, examples or templates and publishing the best-performing version.
- Selective benchmark reporting: showing the tasks on which a model performs well while omitting less flattering results.
- Contamination and leakage: evaluating on material that entered training data, directly or indirectly.
- The AI file drawer: failed runs, null findings and negative replications remain unseen, making the public record look more successful than the work really was.
The commercial consequence is simple. A buyer may be comparing polished outcomes rather than comparable systems. Without the prompts, full benchmark set and failed runs, it is difficult to know how much performance belongs to the model and how much belongs to the presentation.
What I tested across 3,793 open LLMs
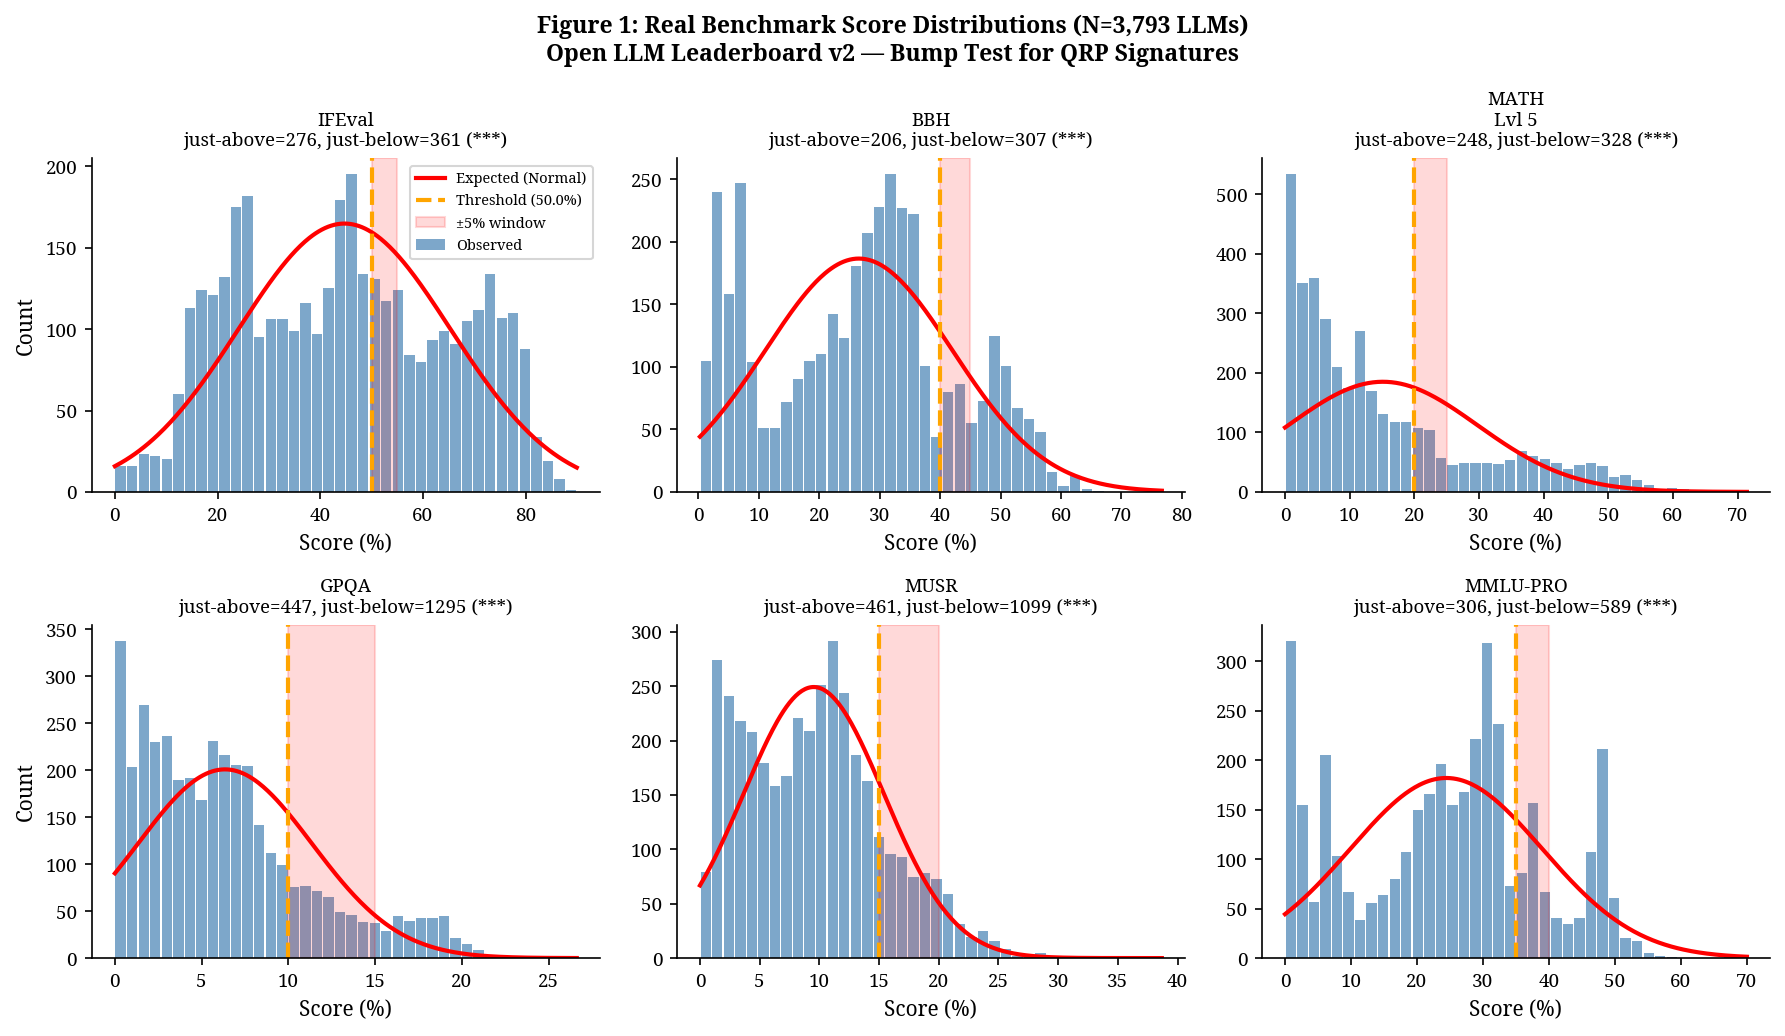
I analysed 3,793 non-merged, non-mixture-of-experts models from the Open LLM Leaderboard v2 across IFEval, BBH, MATH Level 5, GPQA, MUSR and MMLU-PRO. The study tested score distributions around plausible performance thresholds, measured the relationship between model size and average score, and used a genetic algorithm to explore how much selective practices could reproduce the observed pattern.
The method adapts a framework originally developed to detect questionable research practices in published psychology. Here, it is used as a diagnostic model for benchmark ecosystems—not as a detector that can identify misconduct by a particular lab or model developer.
Did the leaderboard show classic threshold gaming?
No. Across all six benchmarks, more scores sat just below the tested thresholds than just above them. That is the inverse of the classic pattern expected when results are strategically pushed across a significance or publication boundary.
The more plausible reading is that the thresholds reveal hard capability ceilings: many models approach a difficult performance boundary, while fewer cross it. This matters because a responsible analysis should be able to reject its most dramatic story. The leaderboard did not support a simple claim that developers were gaming round-number thresholds.
Does model size still matter?
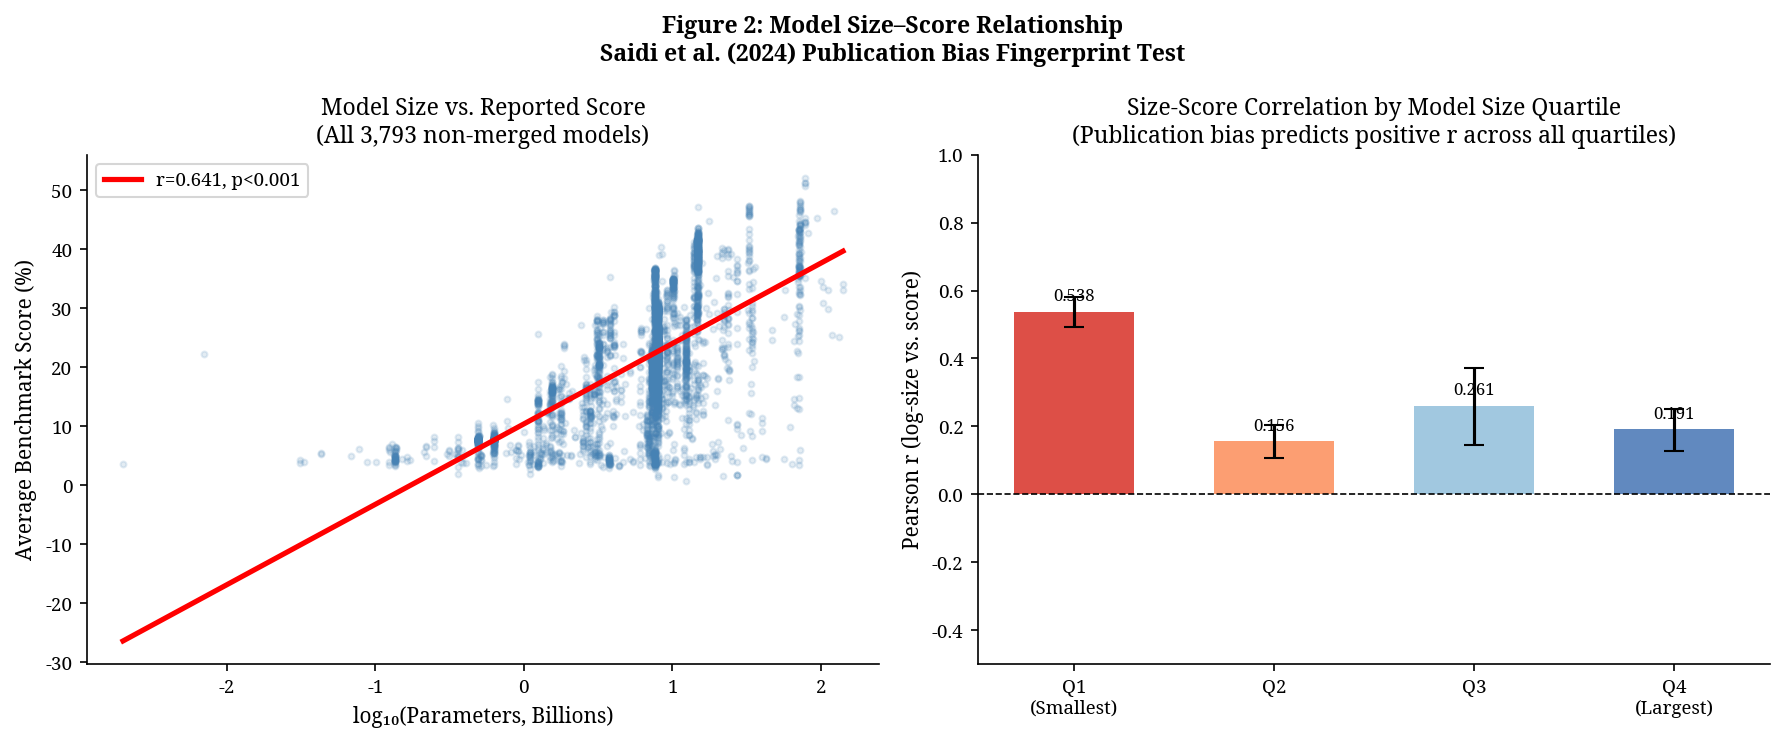
Yes. Model size had a strong positive relationship with average benchmark performance (r = 0.641, p < 0.001). Larger models generally scored better, and the quartile comparison shows the same broad progression.
That is useful precisely because it complicates the crisis narrative. The benchmark ecosystem contains real signal. Scaling gains are visible. Open leaderboards also expose far more results than the selective tables found in many papers and product announcements. The problem is not that every score is fake; it is that real effects and flexible reporting can coexist.
How large could benchmark inflation be?
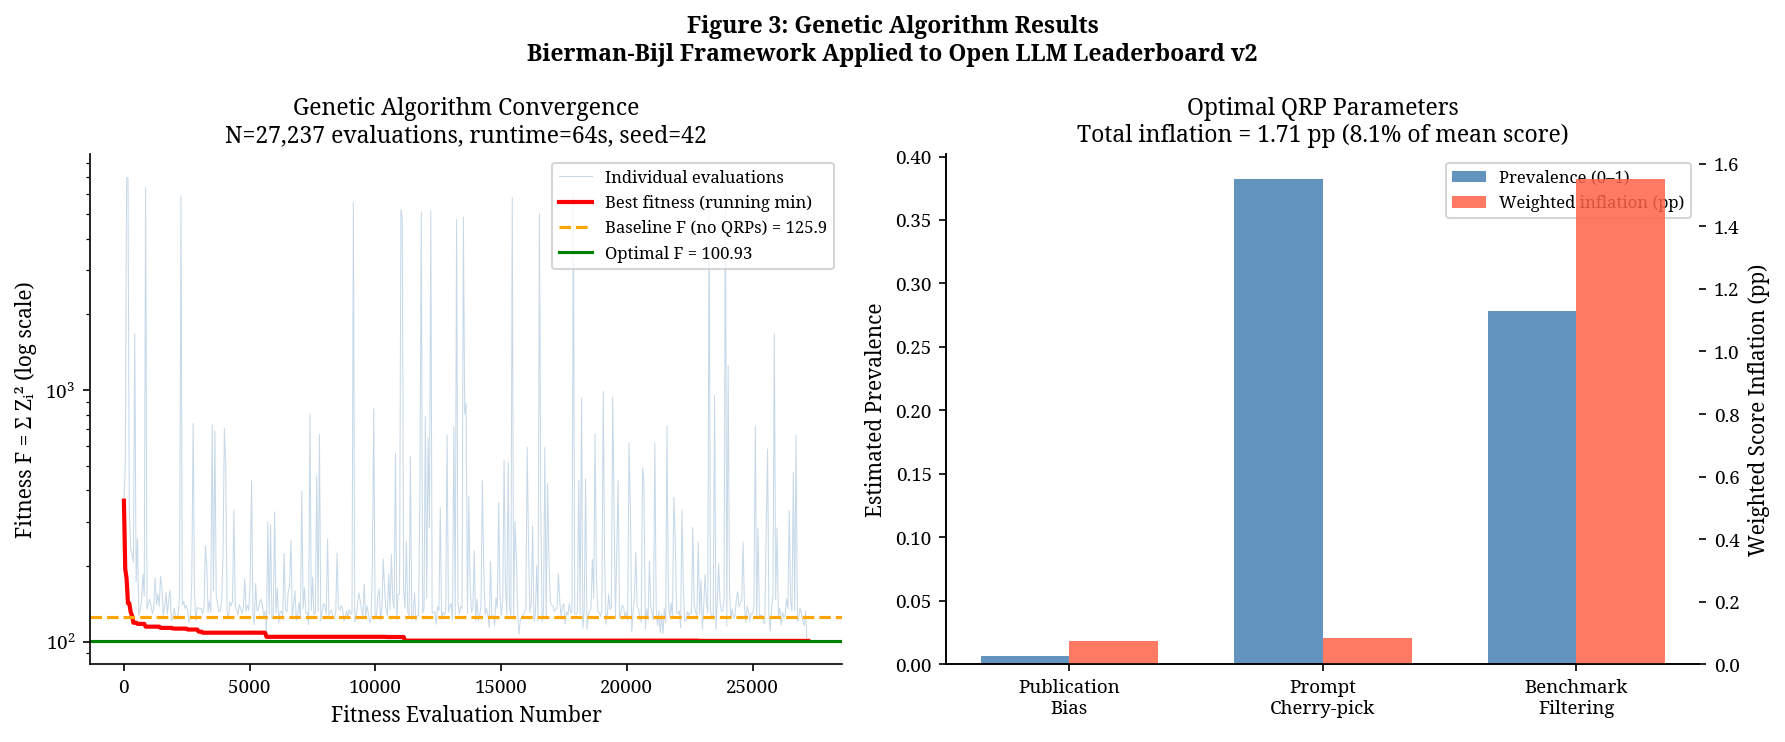
The best-fitting genetic-algorithm model estimated prompt cherry-picking at about 38.3% and selective benchmark filtering at about 27.8%. Together, those practices corresponded to an estimated 1.71 percentage points of score inflation—about 8.1% relative to the mean score in the model.
Those figures are not a census of undisclosed practices and they are not uniquely identified ground truth. They are model-dependent estimates: the parameter combination that best reproduced the observed score pattern under the assumptions of the simulation. They should be read as a plausible scale of risk, not a conviction rate.
What should a reproducible LLM evaluation report?
A trustworthy evaluation does not require the elimination of every judgment call. It requires making consequential judgment calls visible before the result is used to sell a model or support a decision.
- Pre-register the evaluation protocol, benchmarks, metrics and decision rules where practical.
- Publish every material prompt template, system instruction and few-shot example used in testing.
- Report the number of prompt variants and evaluation attempts, not only the winning configuration.
- Show the complete planned benchmark set, including weak, null and failed results.
- Record seeds, decoding settings, model versions and relevant infrastructure details.
- Check for contamination and disclose what could not be ruled out.
- Report uncertainty and variation across runs instead of a single immaculate score.
- Make the pipeline independently replayable and reward negative replications rather than burying them.
What should buyers and builders do with a benchmark score?
Treat the score as evidence, not a verdict. Ask whether the result survives prompt variation, whether the test data may have leaked into training, whether all intended benchmarks were reported, and whether an independent team can reproduce the run. A leaderboard position answers none of those questions on its own.
For a production system, the decisive evaluation is usually closer to the work: representative tasks, explicit failure conditions, versioned prompts, traceable test data and repeated runs. A benchmark can help select candidates. A reproducible evaluation tells you whether the system is safe to believe.
Source notes
- Full paper: The Reproducibility Crisis in AI (PDF)
- Open LLM Leaderboard v2
- Bierman, Spottiswoode & Bijl (2016): Testing for questionable research practices
- Kapoor & Narayanan (2023): Leakage and the reproducibility crisis in ML-based science
- Leech et al. (2024): Questionable practices in machine learning
The simulation estimates are model-dependent and should not be read as direct measurements of undisclosed practices by individual developers.